---
title: "HTML5 Resource Performance"
summary: "New Chrome performance monitoring tool"
date: 2013-10-03
authors: [zack-bloom]
topics: [Frontend]
canonical: https://product.hubspot.com/blog/webkit-resource-performance
cover:
scene: webkit-resource-performance
alt: "Workers punch in at a time clock one after another, while a snail with its card on its shell crawls the whole way, leaves a dotted silvery trail along the floor and up the post, and punches in last, its card glowing in the slot."
---
There is a little known portion of the HTML5 performance API which has made it into Chrome:
```
performance.getEntries()
```
It returns performance information for every resource and request the page has made:
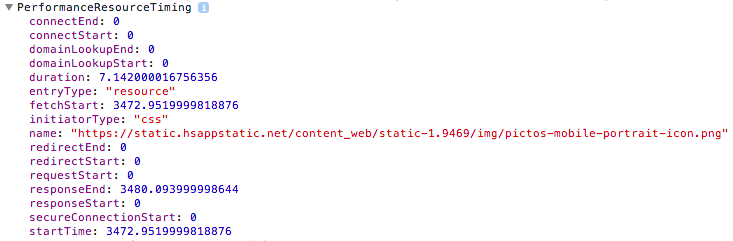
Use it to include performance information in your error reports, or log it to your server to better understand what your users are experiencing. You can do that logging with Google Analytics, or stay tuned, HubSpot will be releasing our own [open-source metrics collection tool](http://github.hubspot.com/bucky) in the next few days.